Graph Recommender Study 01
Graph Neural Net, Recommender System 학습 기록
그래프 딥러닝, 추천 시스템 공부한 내용 실습을 위해 생성한 repo
Lecture
CS224W: Machine Learning with Graphs / Stanford / Winter 2021
Course Info
Lectures
CS224W: Machine Learning with Graphs | 2021 | Lecture 1.1 - Why Graphs
Books
Graph Neural Network
Graph Representation Learning Textbook(CS224W 교재)
Yao Ma, Jiliang Tang - Deep Learning on Graphs-Cambridge University Press (2021)
Recommender System
Charu C. Aggarwal (auth.) - Recommender Systems_ The Textbook-Springer International Publishing (2016)
Matrix and Tensor Factorization Techniques for Recommender Systems by Panagiotis Symeonidis, Andreas Zioupos (auth.)
Network Theory
Albert-Laszlo Barabasi - Network Science-Cambridge University Press (2016)
Graph Recommender System Papers
Matrix_Factorization_Techniques_for_Recommender_Systems
BPR: Bayesian Personalized Ranking from Implicit Feedback
Neural Collaborative Filtering (NCF)
Neural Graph Collaborative Filtering (NGCF)
LightGCN
UltraGCN
GRL 기초 논문

첫 실습 Cocktail DB Visualizer Project
Networkx 모듈을 활용하여 네트워크 만들기 실습
연습용으로 사용할 DB
IBA(International Bartenders Association - IBA) 칵테일 제조 레시피 DB
집에 쌓아둔 술들을 잘 활용하기(?) 위한 선택

import networkx as nx
import requests, json
import numpy as np
Read json from recipe DB
json_path = 'https://raw.githubusercontent.com/JunPyoPark/cocktails/master/src/data/cocktails.json'
url = requests.get(json_path)
text = url.text
data = json.loads(text)
len(data) # 80개의 레시피
data[0]
ingredient_list = data[0]['ingredients']
ingredient_list
Create Graph(Network) from recipe DB
import networkx as nx
from itertools import combinations
G = nx.Graph()
total_ingredients = []
for recipe_num in range(len(data)):
    recipe = data[recipe_num]
    ingredients = recipe['ingredients']

    ingredient_list = []
    for ingredient in ingredients:
        try:
            ingredient_list.append(ingredient['ingredient'])
        except:
            pass

    # add nodes
    G.add_nodes_from(ingredient_list)

    # add edges
    edges = list(combinations(ingredient_list, 2))
    G.add_edges_from(edges)
Visualize
import matplotlib.pyplot as plt
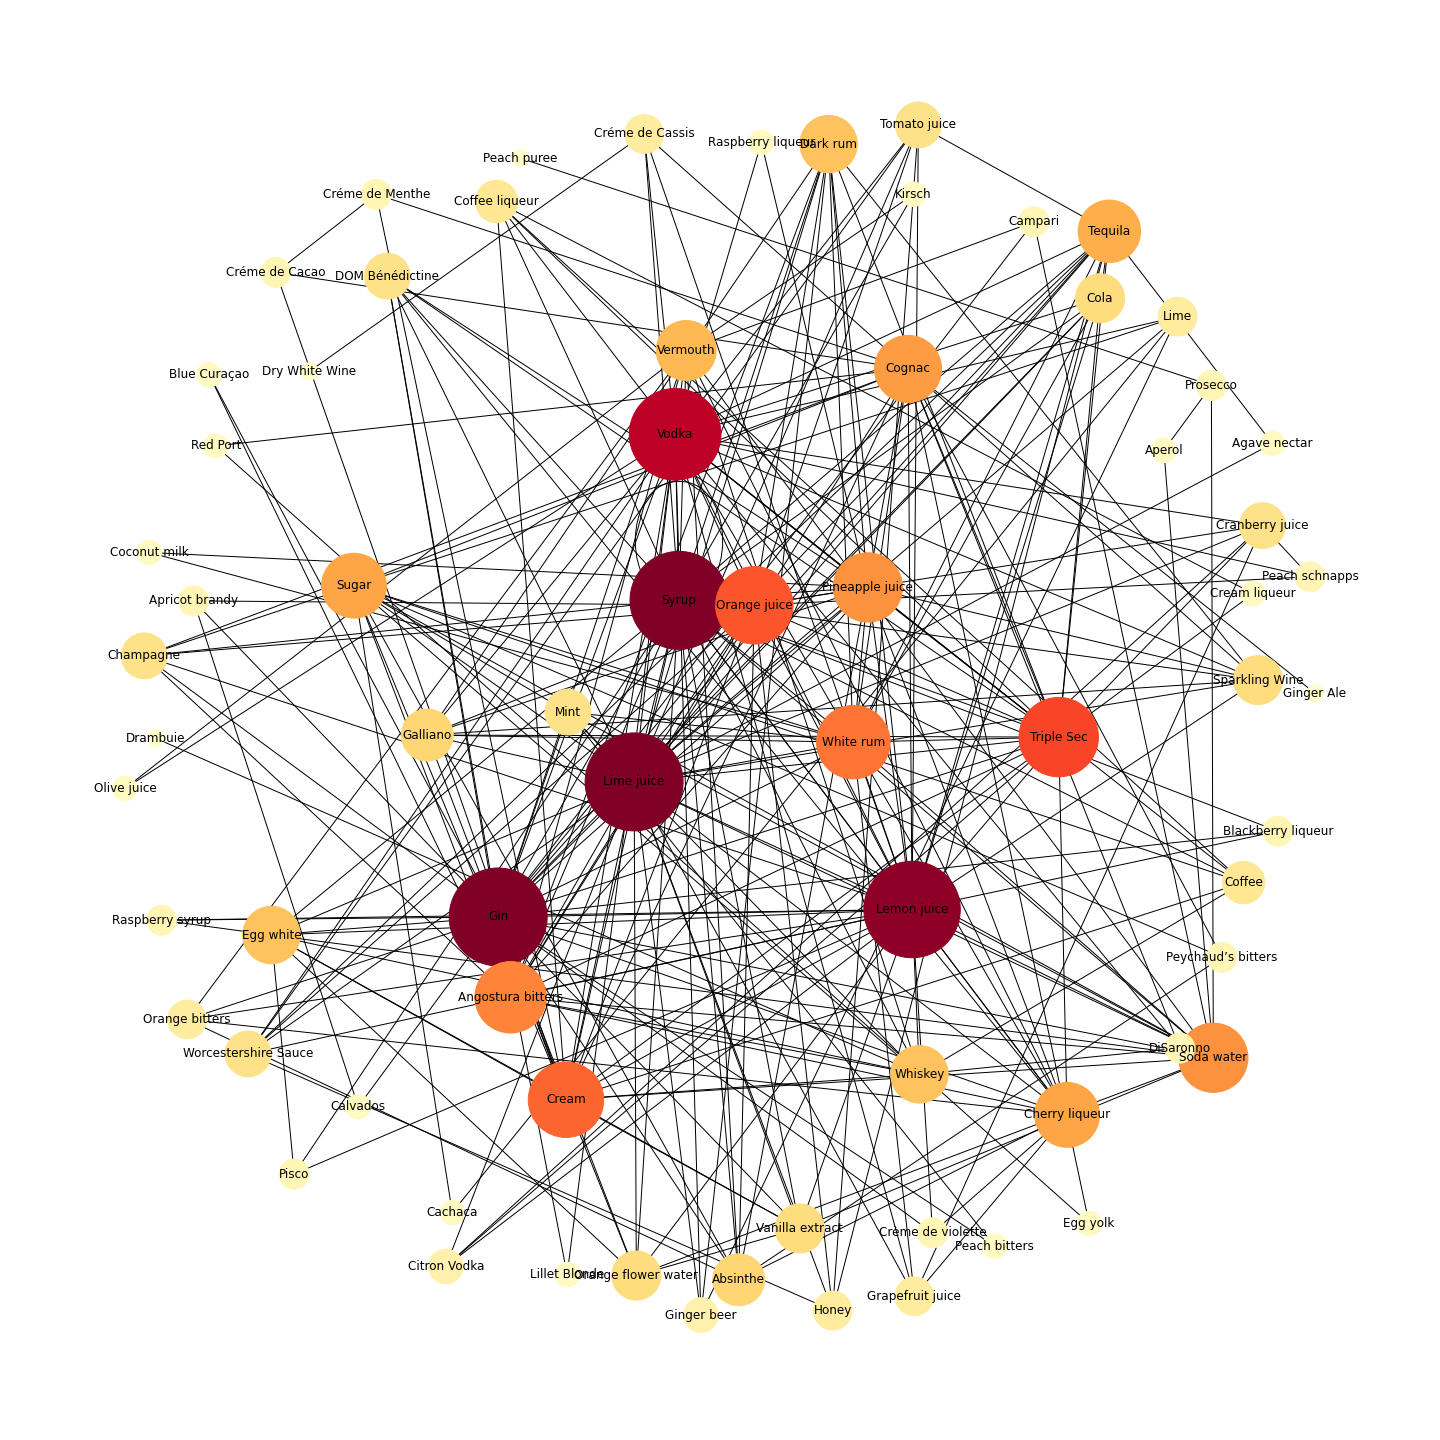
노드의 Degree를 계산하여 시각화 할 때 사용합니다. (연결이 많이 된 노드를 크게 그리기 위함)
dig = dict(nx.degree(G)) # degree of network
d = np.array(list(dig.values()))
pos=nx.spring_layout(G,k=2) # positions for all nodes
plt.figure(figsize=(20,20)) #Control figure size
nx.draw(G,pos,with_labels=True
        ,node_size = d * 300 # node size (degree에 비례한 노드 크기)
        ,node_color= d # data for label color (degree에 따른 컬러맵 사용)
        ,font_size= 12 # labelsize
        ,cmap=plt.cm.YlOrRd # color_map
       )
plt.title('Cocktail Recipe DB Network',size=20);
plt.savefig('Graph.png', format="PNG") # Save figure

크기가 커서 웹에서 쫌 깨져보이네요.... 이미지 크게 보기
결론: 나머지 큰 재료들은 가지고 있으니까 진 한병 사면 더 많은 칵테일을 말아 먹을 수 있겠다!!!