Stock Fraud Detection Using Peer Group Analysis
금융공학 네트워킹 논문리딩 발표자료 - Stock fraud detection using peer group analysis
금융공학 네트워킹 논문리딩에서 발표한 자료와 코드 입니다. 코드는 해당 논문을 보면서 직접 만들어 보았습니다.
- 논문 주소 : https://www.sciencedirect.com/science/article/pii/S0957417412002692
- 발표 자료 : https://www2.slideshare.net/ParkJunPyo1/stock-fraud-detection-using-peer-group-analysis
by JunPyo Park
Import Modules
import pandas as pd
import matplotlib.pyplot as plt
import numpy as np
%matplotlib inline

plt.rcParams["font.family"] = 'GULIM'
plt.rcParams["axes.grid"] = True
plt.rcParams["figure.figsize"] = (12,6)
plt.rcParams["axes.formatter.useoffset"] = False
plt.rcParams['axes.unicode_minus'] = False
plt.rcParams["axes.formatter.limits"] = -10000, 10000
Read Data
# 데이터가 없다면 FinanceDataReader 설치하여 아래 코드를 통해 다운로드 가능
import FinanceDataReader as fdr
stocks = fdr.StockListing('KOSDAQ') # 코스닥
name_code = stocks[['Name','Symbol']]
for name, code in name_code.head().values:
    print(name,code)
df_list = [fdr.DataReader(code, '2016-05-01', '2019-09-30')['Close'] for name, code in name_code.values]
df = pd.concat(df_list, axis=1)
df.columns = name_code['Name']
df = df.dropna(axis=1) # drop nan
df = pd.read_pickle('kosdaq.pkl')
df.head()
Preprocessing
논문에서 분석 기간의 종가의 최솟값이 5천원 이상인 종목들을 필터링 하였는데 사실 왜 했는지 모르겠다.... 시가 총액도 아니고 종가를 기준으로?? 일단 비슷하게 만원 이상인 종목들을 날려보자
classify a company as a global outlier if the minimum daily closing price since 2004 is greater than m=5000
(df.min() >= 10000).sum()
df = df[df.columns[df.min() < 10000]]
df.head()
Train, Test 분리
논문과 같이 40개월 코스닥 데이터를 사용했으며 18개월(2016-05-01 ~ 2017-10-31)을 트레이닝 셋으로 사용
train_df = df[:'2017-10-31']
len(train_df)
train_df = train_df.iloc[3:]
len(train_df)
11월 부터 테스트 셋
test_df = df['2017-10-31':]
len(test_df)
Smoothing the dataFrame

5일씩 Non overlap 하게 짤라서 평균을 내어 smoothing
def smooth_df(df):
    D = len(df) # 365
    N = int(D/5) # 73
    window_length = int(D/N) # 5
    print(D, N, window_length)
    df_smoothed = pd.DataFrame(columns = df.columns, index=range(N))
    for i in range(N):
        start_iloc = i * window_length
        end_iloc = start_iloc + window_length
        y_i = df.iloc[start_iloc:end_iloc].mean(axis=0)
        df_smoothed.iloc[i] = y_i
    return df_smoothed
train_df
train_df_smoothed = smooth_df(train_df)
train_df_smoothed
Normalize
def normalize_df(df):
    return (df - df.mean())/df.std()
train_df_normalized = normalize_df(train_df_smoothed)
train_df_normalized
Target 선정
target1 : 네이처셀
test period에 주가 조작 이슈 있었음
https://www.hankyung.com/finance/article/2018061279391
df['네이처셀'].plot(title='네이처셀 종가'); # target1
span_start = test_df.index[0]
span_end = test_df.index[-1]
plt.axvspan(span_start, span_end, facecolor='gray', alpha=0.3);
target2 : 제일제강
test period 에 보물선 관련 주가조작 이슈 있었음
https://news.joins.com/article/22919304
df['제일제강'].plot(title='제일제강 종가'); # target2
span_start = test_df.index[0]
span_end = test_df.index[-1]
plt.axvspan(span_start, span_end, facecolor='gray', alpha=0.3);
네이처셀로 진행
target_series = train_df_normalized['네이처셀'] # X_i
Train 기간 동안 Peer Group 선정
def calc_euc_dist(series): # Euclidean Distance
    return np.sqrt(((target_series - series) ** 2).sum())
dist = train_df_normalized.apply(lambda x : calc_euc_dist(x), axis=0)
dist.head()
dist_sorted = dist.sort_values()[1:] # 자기 자신 제외
dist_sorted
dist_sorted.describe()
거리가 가까운 k(=50)개의 peer 선택
k = 50
top_k_peers_distance = dist_sorted.head(k)
top_k_peers_distance
# target
target_series.plot();
# Peer Group
top_k_peers = top_k_peers_distance.index
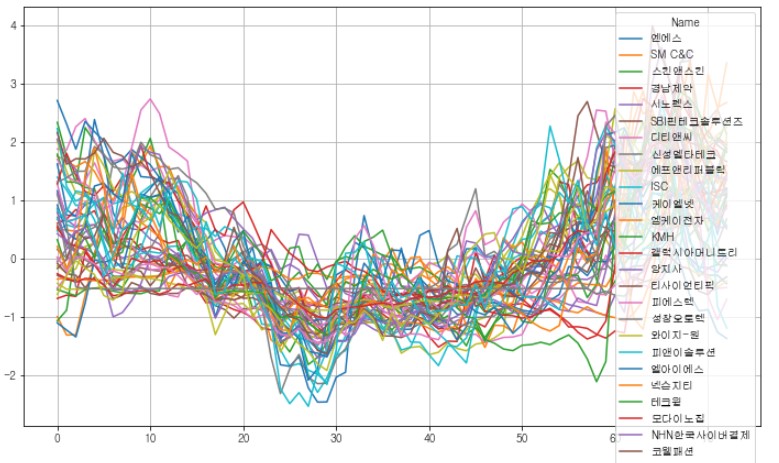
train_df_normalized[top_k_peers].plot(figsize=(12,7));
Peer Group Summary 계산
- Simple Mean : 단순 평균
- Weighted Mean : 논문에서 새로 고안한 weight를 부여

top_k_values = train_df_normalized[top_k_peers] # y_i_pi(j)
top_k_values
gamma = 10
prox = np.exp(-gamma * top_k_peers_distance)
weight = prox / prox.sum()
weight
p_i_simplemean = top_k_values.apply(lambda x : x.mean(), axis=1) # simple mean
p_i_weighted = top_k_values.apply(lambda x : x.dot(weight.T), axis=1) # weighted mean
p_i_weighted
Peer group summary plot
p_i_weighted.plot(label='weighted');
p_i_simplemean.plot(label='simple');
target_series.plot();
plt.legend();
Peer group updates
weight
Peer Group Summary Update
테스트 기간을 돌면서 대푯값을 업데이트 해줘야 함
Test Set Smoothing and Normalizing
len(test_df)
test_df_smoothed = smooth_df(test_df) # smoothing
test_df_smoothed
# train set 의 mean 과 std 사용하여 normalize
mean = train_df_smoothed.mean()
std = train_df_smoothed.std()
test_df_normalized = (test_df_smoothed - mean)/std
test_df_normalized
test_target_series = test_df_normalized[target_series.name]
test_target_series
test_df_normalized[top_k_peers]
Update Weight
param_lambda = 0.2
T = len(test_df_normalized)
weight_df = pd.DataFrame(columns=top_k_peers, index=range(T))
weight_df

for t in range(T):
    sum_prox_j = 0
    x = test_target_series[t]
    prox_j = {}
    for j in top_k_peers: # j : company name
        x_pi = test_df_normalized[j][t]
        d_pi = np.abs(x - x_pi)
        prox_j[j] = np.exp(-gamma * d_pi)
        sum_prox_j += prox_j[j]
    for j in top_k_peers:
        weight[j] = (1-param_lambda) * weight[j] + param_lambda * (prox_j[j] / sum_prox_j)
    weight_df.iloc[t] = weight
Weight Plot
최근 기간의 움직임이 유사한 peer에는 큰 weight가 반대로 유사하지 않은 peer에는 작은 값이 부여되도록 조종됨
weight_df.plot();
plt.legend().set_visible(False);
Update Peer Group Summary
계산된 변동 weight를 통해 대푯값 업데이트
test_p_i = (weight_df * test_df_normalized[top_k_peers]).sum(axis=1)
test_p_i
# 종가
test_df_smoothed[target_series.name].plot();
test_target_series.plot(label = 'target');
test_p_i.plot(label = 'centroid');
plt.title(target_series.name)
plt.legend();
Evaluation
그룹의 대푯값 (centroid)를 threshold 범위 이상 벗어날 시 fraud한 종목으로 인식

논문에서는 Fraud한 종목에 대한 레이블된 데이터가 있어서 모델 평가를 진행하고 각종 parameter에 대한 sensitivity 분석 등을 진행 (저는 그런 데이터가 없어요...)
다른 종목에 돌린 결과
